Academic Performance and 'Value Added'
While academic success is just one part of a Sandroyd education, we take great pride in the progress our pupils make in the classroom. We use a wide range of assessments—internal and external, qualitative and quantitative—to ensure each child is supported and challenged appropriately.
Our primary aim is to spark curiosity and a love of learning. The academic curriculum is carefully designed to stretch and support each child as they prepare for Common Entrance or Scholarship exams, important milestones that reflect the high standards we uphold. At the same time, our teaching equips pupils with the foundations and confidence they need to thrive at their Senior Schools and beyond.
GL Assessment Data
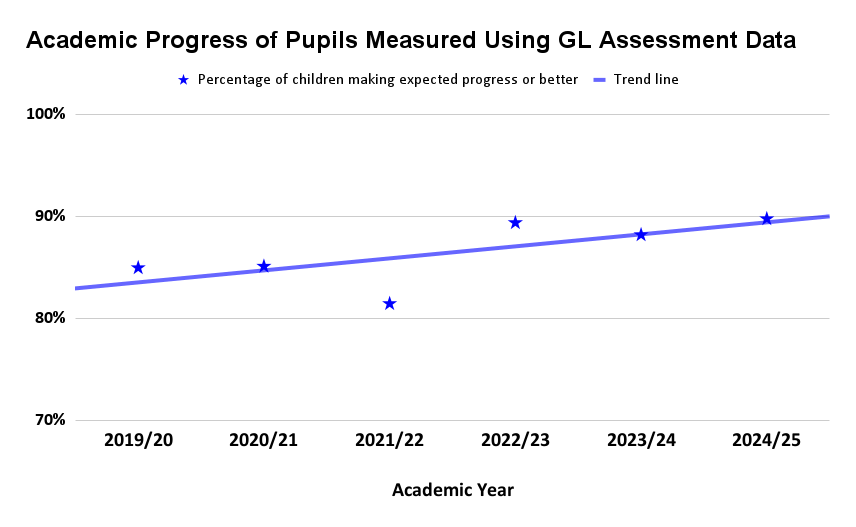
We use GL Assessment Progress tests to monitor the academic development of our pupils across multiple subjects. These external evaluations measure a variety of skills and yield a Standard Age Score (SAS), as well as indicating how much academic progress has been made across a number of subjects. In addition, our bespoke database, Sandfly, biannually assesses the 'value added' to each pupil's educational journey at Sandroyd.
We are proud to publish our 'Value added' results below:
Academic Scholarships
In addition to Common Entrance, a number of children are awarded academic scholarships to their senior schools each year. Over the past five years, 40% of our leavers who have gone on to public schools have gained a scholarship award. Our overall scholarship results can be found by clicking here.
The results of our academic scholarships can be seen below:
2025 Academic Awards
- Canford
- Kingswood
- Sherborne
2024 Academic Awards
- Marlborough
- Monkton
2023 Academic Awards
- Charterhouse
- Marlborough
- Monkton
- Radley (Exhibition)
- St Mary’s Calne
2022 Academic Awards
- Marlborough
- Winchester College
2021 Academic Awards
- Bryanston (Award)
- Sevenoaks
2020 Academic Awards
- Marlborough
- Sherborne Girls (Exhibition)
2019 Academic Awards
- Bryanston
- Sherborne Girls
- Sherborne Girls (Exhibition)
- Sherborne
- Winchester College
Updated - July 2025